
Started a new way to map the visual add-ons to the buildings in the area. Is there a connection between visuall add-ons (commercial signs, roadsigns, graffiti etc..) and tempo, temporality, action, etc...
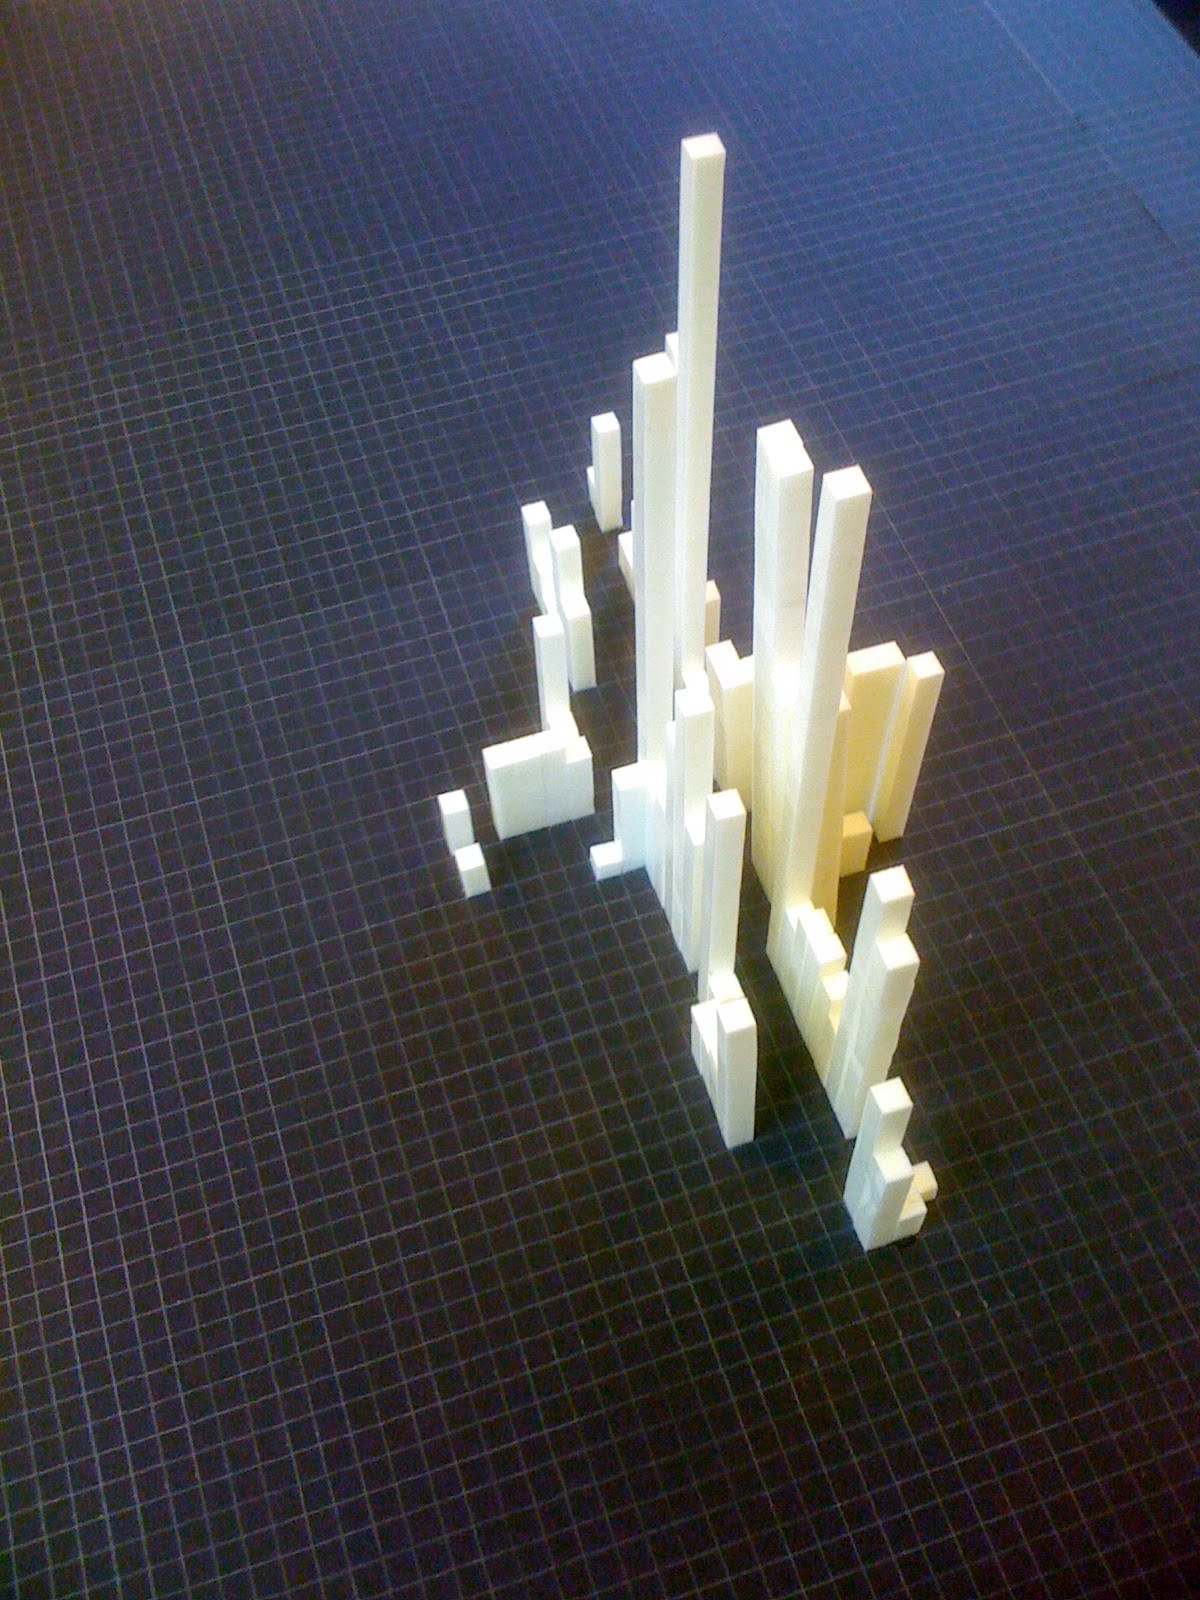
A grid 1x1 cm is put on top of the 1:1000 map, each facade is thouroughly examined. The first column makes up the shopowners/buildingowners add-ons to the existing facade. This is put up in order to gain attention and costumers, the rule seems to be that the one that screams highest gets the cash. The actual number of signs makes up the hight of the column, one cm pr. sign. Secondly, the column shows the number of "official signs, i.e. the ones that shows important information regarding the actual use of the area, the rules etc., this is another layer of information and is put up with no other aim than to secure a well-functioning society/infrastructure. The third column on top shows the actual number of tags/graffiti on the building facades. These are made by people that seemingly has no right to the facade, its an individuals intervention on private owned buildings and this defragmentizes the boundaries between public/private. This is also connected to the broken window theories, can I through an abstract presentation of this data see more clues to how this relates to our interpretation of the cityscape?
Ingen kommentarer:
Legg inn en kommentar